|
AUTO–MUTE |
|
|
AUTO-MUTE Home |
Stability Changes (ΔTm) DocumentationIntroductionStability
Changes (ΔTm) is an
automated server for predicting the impact of single amino acid
replacements on protein stability due to changes in median melting
temperature. The
models available were trained
with a modified version of a mutant protein dataset which was
previously reported in Saraboji
et
al. (2006) and obtained by searching the ProTherm
database. The original
dataset consisted of 1791 single amino acid substitutions in 68
proteins with solved structures in the Protein
Data Bank (PDB);
however, after
removing mutants associated with structures containing
gaps, as well as mutants at positions with fewer than six nearest
neighbors in tessellated protein structures, the modified dataset utilized
here consists of 1749 single point mutants in 64 protein structures.
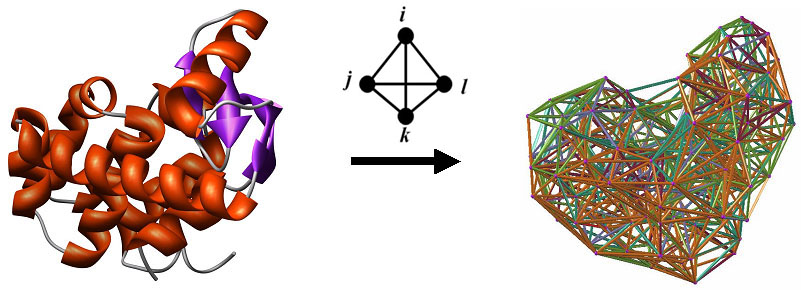
Depending upon the needs of the investigator, two supervised classification models (for predicting only the sign of ΔTm) and two regression models (for predicting the actual value of ΔTm) are available. The supervised classification models include a C4.5 decision tree classifier augmented by Adaboost adaptive boosting (AdaboostM1/C4.5) and Support Vector Machine (SVM), while the regression models include Tree regression (REPTree) and SVM regression (SVMreg). Similarly, the decision as to which of the two classification (or regression) models to select rests with the algorithmic preference of the researcher. Athough the two models of each type can be ranked based on various performance measures, which are detailed in the Results section below, these measures are relatively similar in magnitude and are not necessarily indicative of the predictive accuracy of the models on an independent test set of single point mutants that have yet to be experimentally investigated. Additionally, since the models were developed using implementations of four different machine learning algorithms, there likely will be occasions where predictions for a specific mutant are inconsistent among the models, especially in cases where the sign of ΔTm is predicted with low confidence. Lastly, predictions can only be performed for a mutant if it represents a single amino acid substitution in a tessellatable single chain of a solved protein structure with a coordinate file available in the PDB. Specifically, Delaunay tessellation of the structure can be performed if the PDB file contains consecutive primary sequence numbering in the ATOM lines (i.e., no gaps in the structure) starting with a non-negative integer, the alpha-carbon atomic coordinates are available for all the constituent amino acids, and no alternative conformations exist for the alpha-carbon atoms. In addition to X-ray structures, NMR structure files are potentially tessellatable if they consist of a single minimized average structure as opposed to multiple models. Methods Among the numerous factors influencing model performance are the dataset size and composition utilized for training, the type of attributes (i.e., predictors) used as components for the feature vectors characterizing the mutants in the dataset, and the machine learning algorithm chosen for model building. AUTO-MUTE utilizes attributes that include EC score at the mutated position (mutant protein residual score), ordered EC scores of the six nearest neighbors to the mutated position, native and replacement amino acid identities at the mutated position, ordered amino acid identities at the six nearest neighbors, and ordered differences between the primary sequence positions of the nearest neighbors and the mutated residue (see AUTO-MUTE home page for details). The relative solvent accessibility (RSA) was also included for each single point mutant. However, the models provided on this server for making predictions were trained by replacing RSA with the following Delaunay tessellation-derived attributes: mean volume and tetrahedrality of the simplices in which the mutated position serves as a vertex, location (surface, undersurface, or buried) of the mutated position, number of edge contacts that the mutated position has with surface positions, and secondary structure (helix, strand, coil, or turn) of the mutated position (see AUTO-MUTE home page for details). As described in the Results section below, there is a negligible difference in model performance as a result of such an alteration in the training set mutant feature vectors. Required Inputs and Server Outputs A valid PDB accession code and a specific chain (use @ if null) is required for the structure of the protein containing a single residue substitution whose impact on stability (ΔTm sign or value) is to be predicted. The mutation under consideration must be supplied in the form (native residue)(position number from PDB file ATOM lines)(replacement residue), for example D25E; however, by using an underscore "_" instead of a replacement residue, such as D25_ for example, predictions will be provided for all 19 amino acid substitutions at the requested position. In addition to reproducing the inputs, the output data includes either predicted sign of ΔTm along with a confidence level (classification) or predicted value of ΔTm (regression), mean volume and tetrahedrality for the mutated position, location and number of edge contacts that the mutated position has with surface positions, and secondary structure of the mutated position. Results Performance of the algorithms is detailed below by applying a 10-fold cross-validation procedure and calculating the following values. In the case of supervised classification, each mutant belongs to either the “increased stability” or “+” class if experimental ΔTm ≥ 0, or the “decreased stability” or “–” class if ΔTm < 0. With the understanding that TP (TN) = total number of correctly predicted “increased stability” (“decreased stability”) mutants, and FN (FP) = total number of respectively misclassified mutants, the overall accuracy is defined as Q = (TP + TN) / (TP
+ TN + FP + FN).
Also, for the “increased stability” class, S(+) = sensitivity =
TP / (TP + FN) and P(+) = precision = TP / (TP + FP),
while for the “decreased stability” class, S(–) = TN / (TN + FP)
and P(–) = TN / (TN + FN).
Finally, the following two measures are calculated due to their robustness with respect to unequal class distributions: balanced error rate is defined as BER = 0.5 ×
[FN / (FN + TP) + FP / (FP + TN)],
and Matthew’s correlation coefficient is given by MCC
= (TP ×
TN – FP
× FN) / [(TP + FN)(TP
+ FP)(TN + FN)(TN + FP)]1/2.
In the case of regression, model performance is evaluated by calculating the Pearson correlation coefficient (r) of the predicted and experimental ΔTm values, as well as the standard error.
Next, Saraboji et al. (2006) reported an overall
accuracy of 0.71, based on leave-one-out cross-validation (jackknife)
applied in
conjunction with their average assignment method. Similarly, we applied
the jackknife in
conjunction with AdaboostM1/C4.5 and RF learning, and we utilized only
the initial set of attributes described in the first paragraph of the
Methods section above. Hence, neither
RSA nor its replacement
attributes were included in the
feature vectors
representing the protein mutants in our modified dataset. Based on this
approach, we obtained
overall accuracy values of 0.81 and 0.83, respectively.
Finally, an independent test set of 157 mutants (32 "+" and 125 "–") in 45 protein structures was collected from the ProTherm database. None of the test set mutants appear in the training dataset, and 33 of the protein structures are unique to the test set. A validation study was performed, whereby the test set mutants were each blindly predicted by the server's classification models, with the results tabulated below.
A majority of the independent test set mutants (110 mutants: 25 "+" and 85 "–") are associated with the 33 protein structures that are unique to the test set. For this particular subset, prediction results are Q = 0.90, BER = 0.12, and MCC = 0.73 using the AdaboostM1/C4.5 model (11/110 mutants incorrectly predicted), and Q = 0.88, BER = 0.16, and MCC = 0.67 using the SVM model (13/110 mutants incorrectly predicted).
|